|
Bird Banding Summary |
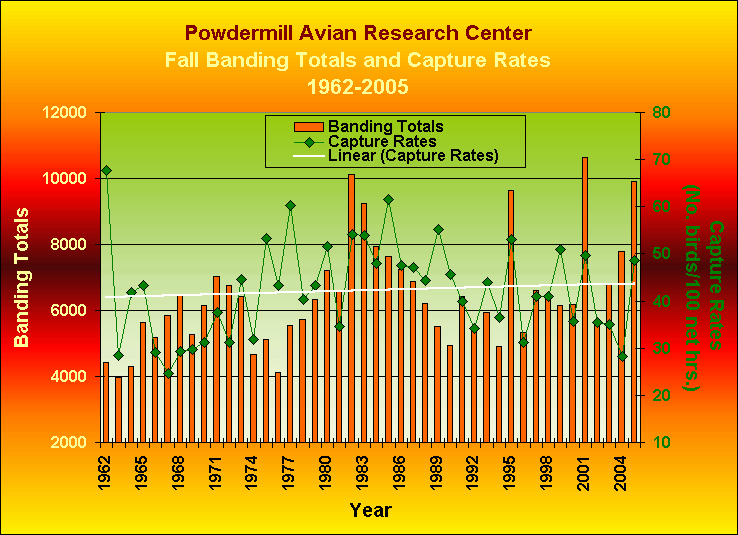
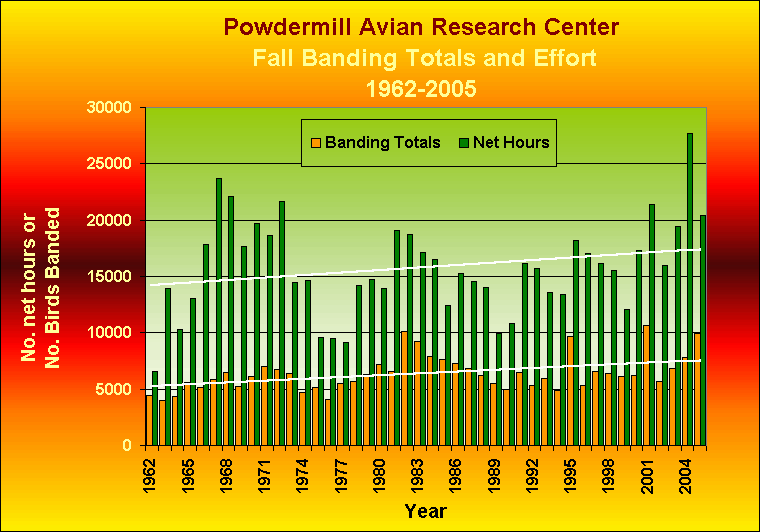
Powdermill Nature Reserve's Bird Banding Program, located on the 2,200-acre biological field station of Carnegie Museum of Natural History in the Laurel Highlands region of southwestern Pennsylvania, completed its 44th consecutive fall migration banding season in 2005. The station was in operation 104 out of a possible 126 days from August through November. Despite weather and predators in the banding area limiting effort throughout a promising November migration, we banded 9,914 birds this season, the third highest fall total in the history of the program (10,637 birds banded in 2001 holds first place and 10,129 birds banded in 1982 is second). We also amassed 20,435 net hours, the fifth highest effort put forth in the 44 year history of the program, reflecting favorable banding conditions throughout the majority of the season. With near record numbers for many individual species as well, we can confidently say it was a positively great fall migration season at Powdermill.
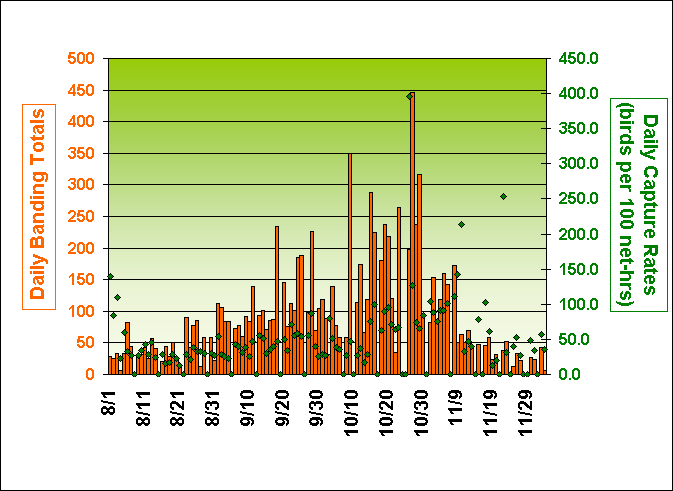
We banded 100 or more birds on 34 days this season, including, 349 birds on 9 October and 446 birds, banded by lamplight in the front yard of the lab, on 27 October following a snow storm that left the reserve without power for three days. That day will not only be remembered because of the conditions endured during a week when we still managed to band over 1,200 birds, but also because it became the eighth highest single day banding total in the history of the program.
|
and Capture Rates |
Overall, 11% of the cumulative total was banded in August, 29% was banded in September, 43% in October, and 17% was banded in November. This is actually the highest percent composition of birds banded in November in, at least, the last five years, further attesting to a strong, late migration of northern sparrow and finch species which, given a larger banding effort in November, would have certainly boosted the final overall total.
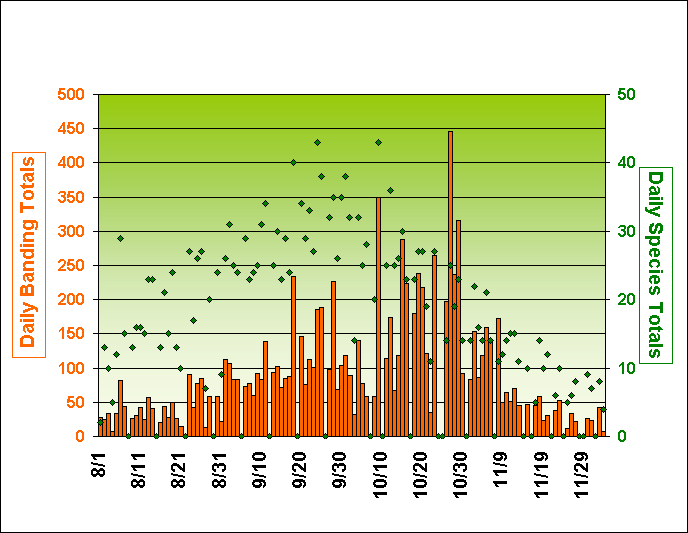
The graph below plots our daily banding totals and capture rates (birds banded per 100 net hours of effort--net hours are calculated as the number mist nets in use times the number of hours they were operated each day). The overall capture rate for this fall (48.5 birds/100 net hours) is the well above the long term average of 42 birds/100 net hours and is the highest we've recorded since the record setting season in 2001. The higher capture rates toward the end of the season reflect good catches of birds from fewer nets centered around feeding stations.
Of particular note is the capture rate of 396.0 on 26 October, the day immediately following the snow storm mentioned above. Because many of the net lanes were impassable from downed trees and branches, we had to limit our effort during a time when large numbers of birds were seeking refuge and cover from the storm around Powdermill. This resulted in a capture rate that was nearly twice the banding total for that day; nearly two birds were caught for every net hour. Between the capture rate on the 26th and the total of 446 birds banded the very next day, one can only imagine what a phenomenal catch might have resulted had we been able to operate at full scale on Wednesday, October 26.
|
Effort
|
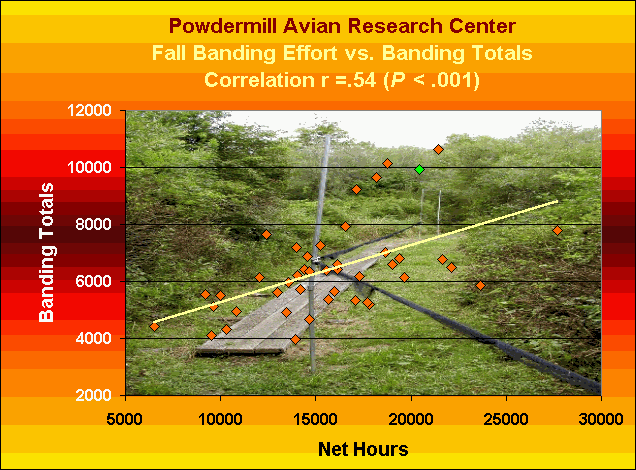
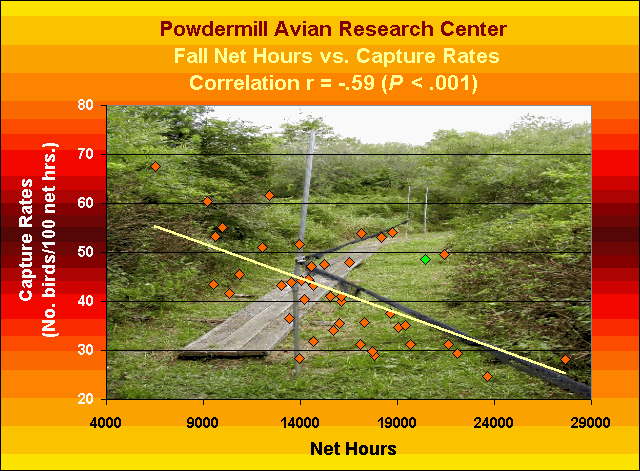
As mentioned above, capture rates have been variable over the years, due, in part, to the variability in fall banding effort at Powdermill--the number of nets used and/or the number of hours of net operation on a given day, as well as the number of banding days during any given fall season, being determined primarily by prevailing weather conditions and the availability and/or level of field assistance. In the graph below, although there appears to be a slight positive trend in banding effort, it is not significant (R2 = 0.05, P > 0.05) and is probably skewed that way because of the extraordinarily high number of net hours of effort in 2004. The slight positive trend in banding totals, however, is statistically significant (R2 = 0.19, P < 0.05).
|
|
We banded 111 species of birds this season, making it the fifth highest species count for any fall season (115 species banded in 1991 is the highest). The diversity of species banded by day is plotted in the graph below. The most specious days (43 each) at Powdermill were on 9/24 and 10/9. While higher species counts usually do not coincide with a high daily banding total, 9 October was also the second highest daily total for the season with 349 birds banded. Click here for a table of species totals for Fall 2005 given in descending order.
|
of Fall Migration |
It is the interspecific variation in timing of migration that gives us this within season variation in species composition and abundance. An early research focus of the founder of the Powdermill banding program, Robert C. Leberman, was the the differential timing of migration between sex classes of a species, particularly during spring (Leberman and Clench. 1971. Powdermill Nature Reserve Research Report No. 28, Carnegie Museum, Pittsburgh, PA). The importance of males to compete for and secure territories on the breeding grounds has been shown as a driving factor for the earlier migration seen in males of many species in the spring. Examining fall migration trends, however, also reveals intraspecific differences, between both age and sex classes, and these, too, have a long history of study at Powdermill (e.g., Leberman and Clench. 1970. Powdermill Nature Reserve Research Report No. 26, Carnegie Museum, Pittsburgh, PA).
The underlying cause for these differences have been unclear as to whether groups differ in onset and/or rate of migration. As discussed in Mulvihill and Chandler (1990. J. Field Ornitol. 61:85-89) and Woodrey and Chandler (1997. Wilson Bulletin 109:52-67), ultimate causes for these differences may be related to molt, experience levels, potential social interactions both on the breeding and wintering grounds, breeding biology, or the selection advantages for either a late departure or earlier arrival on the wintering grounds. After examining migration data for five species from Powdermill and comparing it with migration data from Long Point Bird Observatory (on the north shore of Lake Erie) and a coastal site in Alabama, Woodrey and Chandler found Red-eyed Vireo adults, for example, migrate significantly earlier (not necessarily faster) than immatures.
We have summarized fall migration data from 1962-2003 graphically to show differential patterns between age and sex classes for 96 species. The timing of migration for sexes is separated only for those species where all or most of the individuals could be reliably sexed in fall. The graphs also depict changes in relative abundance of species throughout the fall season and show what species dominate the catch at each point throughout the season at Powdermill. The early departure of adult REVI's, mentioned above, is evident in these figures. This may be related to the limited extent of molt undertaken by adults on the breeding grounds which, ultimately, may permit earlier onset of migration.
While comparative analyses between several sites, such as in the studies cited above, present more of an opportunity to understand further the dynamics and causes underlying differential timing of migration, these data show some interesting patterns and trends and provide a first step for any other researchers who might be interested in exploring this interesting aspect of migration further (see below for data requests)
> click here for graphical representations
Highs |
As would be expected from such a fantastic fall season, a handful of species set record high totals and many others were among the best we've seen in the 44 year history of the program. Eastern Towhee (92 vs. 85 in 1995), Gray Catbird (398 vs. 390 in 1995), Rose-breasted Grosbeak (160 vs. 156 in 2004), Ruby-throated Hummingbird (319 vs. 309 in 1962), and Winter Wren (71 vs. 66 in 2002) were the five species that set record highs this fall with Black-throated Blue Warbler being only one bird shy of tying the record of 101 set just last year. Among the species that, despite not setting a new record high, still staged an impressive flight and were banded in large numbers were:
There were no record low numbers of any species, but there were conspicuously few Cedar Waxwings both banded and observed around the banding station throughout the fall season and even into December. Additionally, there were a handful of "misses" (species for which the long term average is > 1): Olive-sided Flycatcher (banded in only three of the last 15 fall seasons, the last time being in 2003), Yellow-throated Vireo, Marsh Wren (missed for the second season in a row), Cerulean Warbler, Yellow-breasted Chat (up to 19 were banded in 28 of the first 30 years, but no more than two have been banded in any fall in the last 14 years), Evening Grosbeak (none has been banded in the last four fall seasons, and only ten have been banded here in the last eight years; amazingly, a record 511 grosbeaks was banded in fall as recently as 1985).
In the table below, totals and capture rates for Fall 2005 are compared to averages, standard deviations (S.D.), minima, and maxima for the preceding 43 years. White rows highlight species that were one or more S.D. above or below the long-term average for total and capture rate (comparisons were made only for species with a long-term average banding total > 1). Species in red were below average and blue denotes species that were above average in Fall 2005. Species that were greater than two S.D. above the long-term average for raw totals and/or capture rates are denoted in the tables below with a double asterisk (**).
Out of 129 species statistically summarized below, 34 were one or more S.D. above average in terms of the raw banding totals and only two were below. Confirming the importance of accounting for variation in effort when examining long-term trends, as mentioned above, only nine species had capture rates above one S.D. of the long-term average, and six were below.
|
|||||||||||||||||||||||||||||||||||||||||||||||||||||||||||||||||||||||||||||||||||||||||||||||||||||||||||||||||||||||||||||||||||||||||||||||||||||||||||||||||||||||||||||||||||||||||||||||||||||||||||||||||||||||||||||||||||||||||||||||||||||||||||||||||||||||||||||||||||||||||||||||||||||||||||||||||||||||||||||||||||||||||||||||||||||||||||||||||||||||||||||||||||||||||||||||||||||||||||||||||||||||||||||||||||||||||||||||||||||||||||||||||||||||||||||||||||||||||||||||||||||||||||||||||||||||||||||||||||||||||||||||||||||||||||||||||||||||||||||||||||||||||||||||||||||||||||||||||||||||||||||||||||||||||||||||||||||||||||||||||||||||||||||||||||||||||||||||||||||||||||||||||||||||||||||||||||||||||||||||||||||||||||||||||||||||||||||||||||||||||||||||||||||||||||||||||||||||||||||||||||||||||||||||||||||||||||||||||||||||||||||||||||||||||||||||||||||||||||||||||||||||||||||||||||||||||||||||||||||||||||||||||||||||||||||||||||||||||||||||||||||||||||||||||||||||||||||||||||||||
|
|
Following such a fantastic season, there are, of course, many visiting bander friends and colleagues, interns, and volunteers to thank. We'd like to mention the following volunteers, visitors, and interns in appreciation of their help this fall season (in no particular order): Bob and Donna DeLeon, Brian Jones, Jack and Shoko Brown, Emma DeLeon (Bioacoustics intern from the Univ. of Pittsburgh), Don and Amy Smith, Pam Ferkett, Matt Clement, Dan Hinnebusch, John Yerger, Matt Shumar, Kristin Sesser, Molly McDermott, Regina Reeder, Christian Meny, Dan Snell, Carroll Labarthe, Hanna Mounce, Linda and Len Hess, Deb Harding, Dick Byers, Todd Katzner, Randi Gerrish, Jenn Detweiler, Jessica Maggio, David Liebmann, Grace Greenwood, and the Goldstein family. (names in red are those who volunteered a week or more of their time to the fall banding efforts at Powdermill this year) We also enjoyed visits and help from fellow banders: Fred and Carol McCullough, Rosemary Spreha, Guy Ubaghs, Tom Greg, Mark Hopey, Lynn Brandon, and Joe Schreiber.
We thank our workshop participants Sandy Polcyn, Jennifer Maxwell, Jennifer Hanley, Margaret Fritze, Keri Parker, Tyler Beck, and Jessica Scopel for their participation and especially their help and patience during the "busy days" when normal workshop activities were put on hold.
We were fortunate, once again, to be payed an extended visit by Dr. David Norman, our British friend and ringing colleague from the Merseyside Ringing Group, whose visit this fall coincided perfectly for adding assistance and some "overseas" banding insight during part of the first fall bander workshop offered this year. We also appreciate his contribution as guest author for the website update covering highlights from October 4-9.
Finally, we were fortunate to have Cokie and Annie Lindsay, Trish Miller, and Bruce Horner, additional Powdermill staffers, that took time out of their normal daily activities to help wherever needed during busy banding days. We are also extremely fortunate to have Dr. David Smith as the Director of Powdermill Nature Reserve. In addition to the help he's provided on more than one occassion to the general daily banding operations, we are grateful for his unfailing support of the banding program and ongoing research at the Powdermill Avian Research Center. Last, but certainly not least, we thank our data entry operator at Carnegie Museum's Section of Birds, Marilyn Niedermeier, who painstakingly enters, checks and double checks all of our banding records, and who is responsible for generating banding schedules and filling data requests.
|
All tabular and graphical data on this website should be considered provisional.
They are presented here for general interest, not as completed scientific analyses.
We do invite any colleagues who may have a professional interest in working with us to undertake more comprehensive (and/or comparative) analyses of trends in
Powdermill migration banding data to contact us.
Last updated on 02/11/06
by Adrienne J. Leppold